
A disclaimer: I'm stepping outside my expertise as an organic chemist to write about mass spectrometry. This makes me nervous because I might make errors or oversimplify concepts. The intertubes has taught me that there are experts who love to highlight these mistakes—some constructively, but others less helpfully (an understatement. The first draft of this paragraph called these people ‘arsehats’ but I'm far too polite to leave that in print). This summary is not for experts. It is for undergraduates. If there are errors, I’ll happily correct them. On the other hand, if you believe I’m doing students a disservice by failing to mention one of your pet interests, such as the surface chemistry of a droplet during ionization, then we probably need to have a quiet discussion about pedagogy over a pint or two.
Introduction
Mass spectrometry can identify unknown molecules and quantify known compounds. At its simplest, a mass spectrometer measures the mass of a molecule by generating a beam of ions and sorting them by their mass-to-charge ratio. The key word in that last sentence is ions; a mass spectrometer needs charged species before it can do anything useful.
Mass spectrometry impacts (pun intended) most aspects of our lives without us knowing. It is used to identify unknown molecules in the environment, in space, in pharmaceuticals, and in food and beverages. It can quantify, or count, the amount of a known substance in fields as diverse as drug testing to manufacturing processes. While in research settings, it is used to identify proteins, peptides and a whole host of biologically relevant molecules.
Mass spectrometry is a vast area and people far cleverer than me have written books on the subject. To be honest, they’ve written books on tiny, highly focussed, aspects of mass spectrometry never mind trying to summarize it all. My summaries are going to be shorter simplifications of a fascinating subject. They are written by a user of mass spectrometers not an expert in mass spectrometry.
There will be a number of summaries in order to keep them short(ish) and vaguely on topic. The first is a general introduction to what a chemist sees when he or she uses a mass spectrometer. Later, there will be more summaries covering how we get the data and what it can tell you.
Mass spectrometry
A mass spectrometer weighs molecules. It does this by measuring the mass of ions, positive or negatively charged species derived from the parent molecule, as something called the mass-to-charge ratio m/z. This is the first important feature you need to understand, for a mass spectrometer to measure anything you must have a charged species. All the magic that occurs in the instrument is achieved by manipulating charged species with either magnetic or electronic fields. Imagine your have a plastic block. This is your molecule. You also have a magnet. This is your mass spectrometer. The magnet will not influence or move the block. But, if you glue a lump of metal to the block, the magnet can now affect the block. Effectively, by adding the metal you charged or ionized the block. This is what mass spectrometers do, they take a molecule, they ionize it and then they measure it.
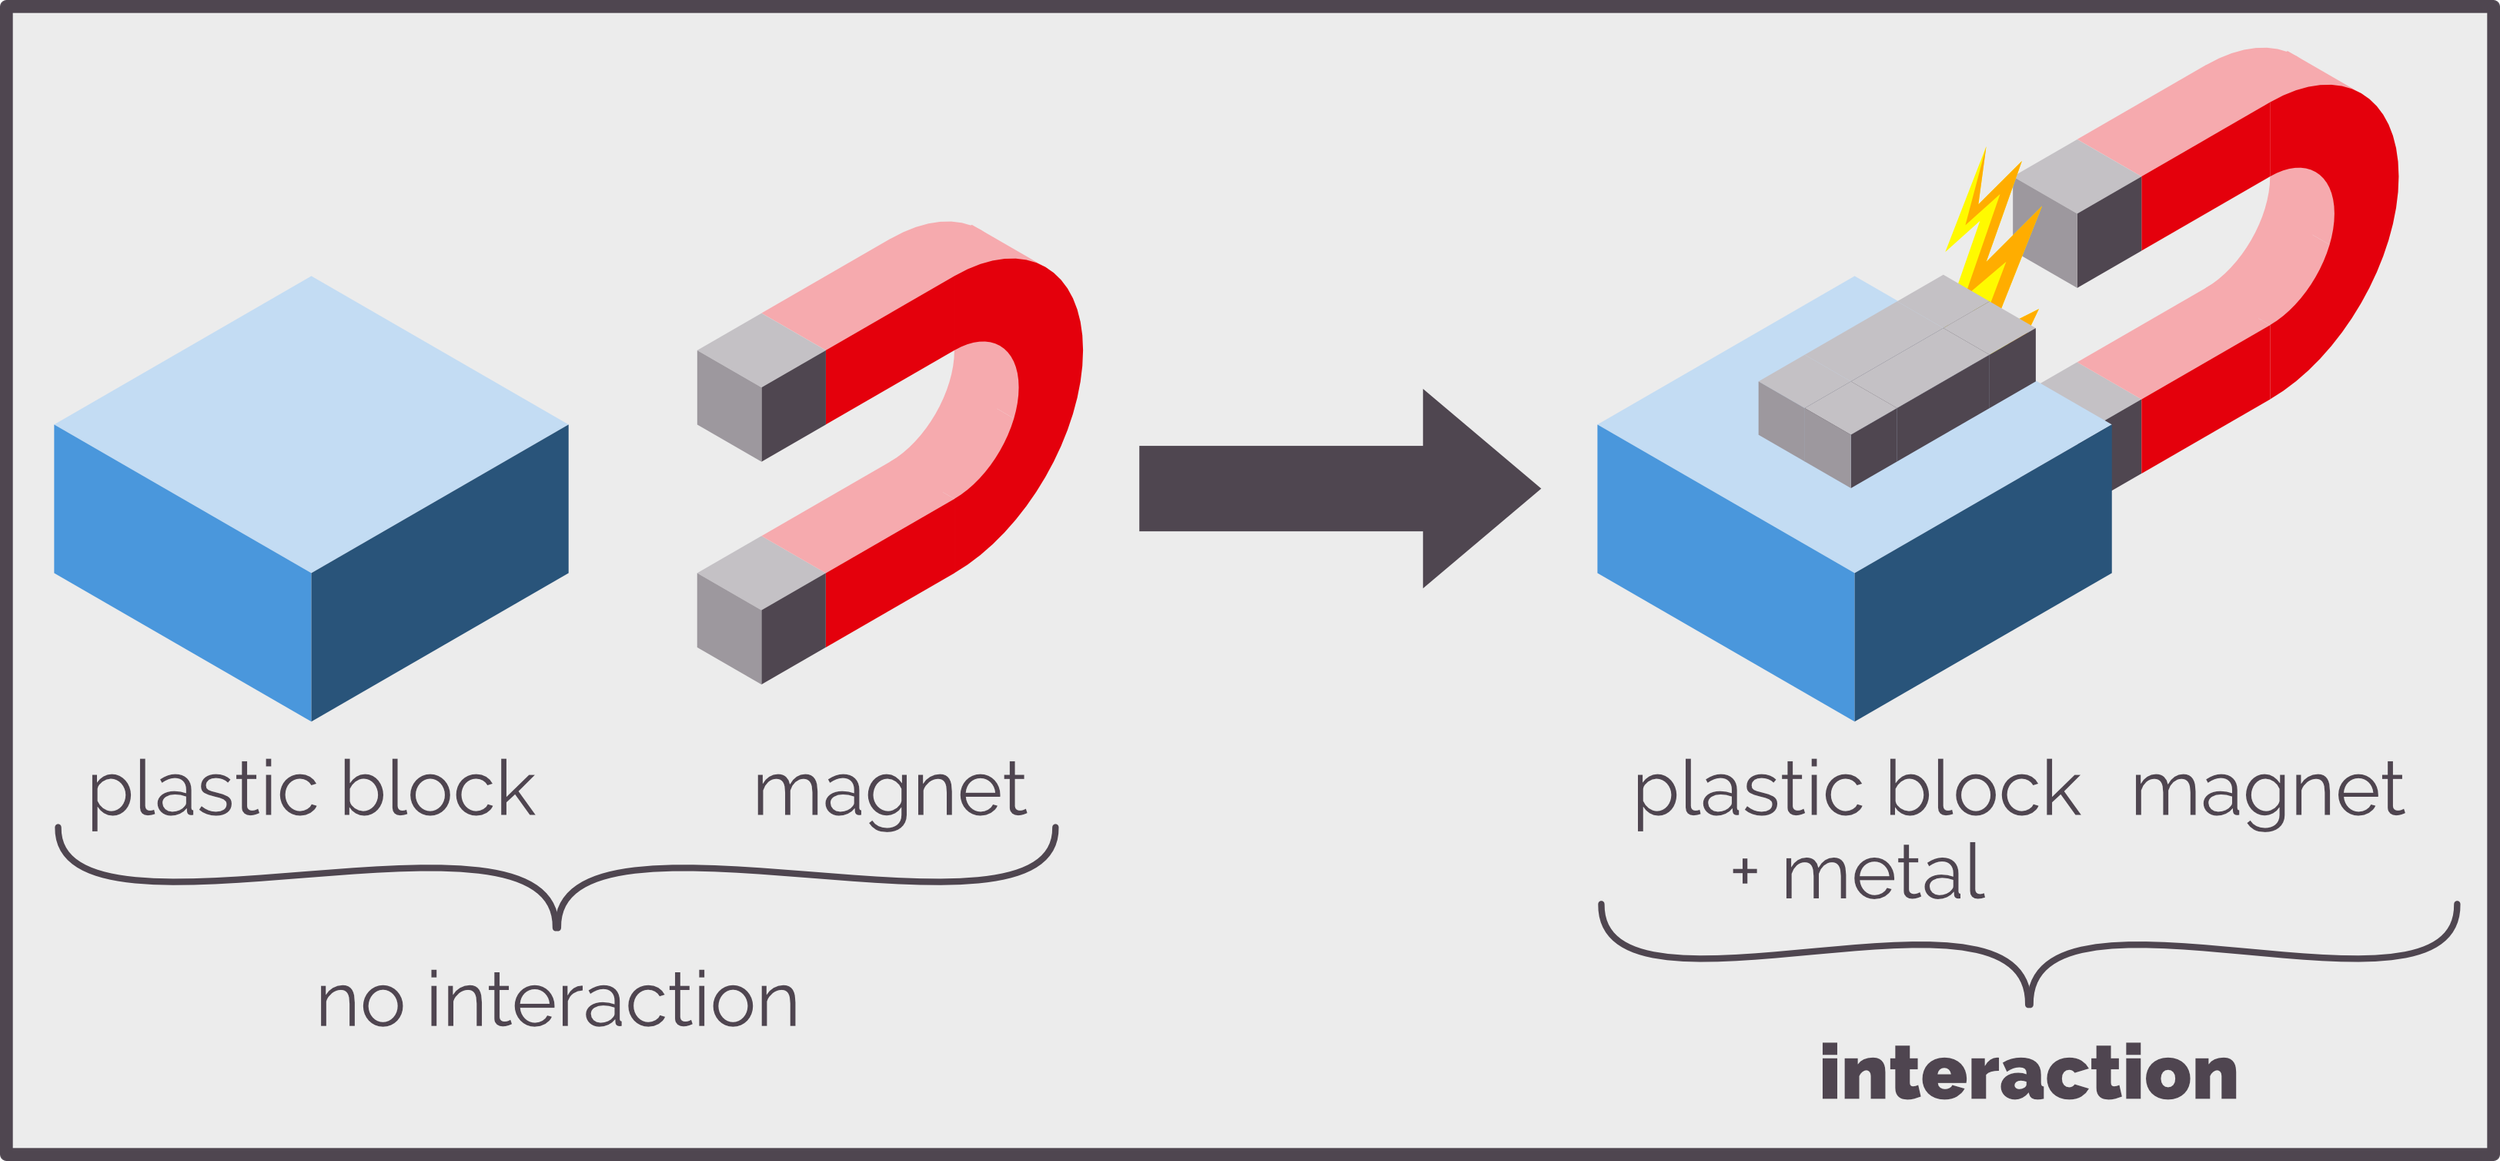
A cartoon that shows that a plastic block will not interact with a magnet yet if you attach a metal rod it will. This is analogous to mass spectrometry, neutral molecules do nothing but if you create a charge you can manipulate the resulting ion within the spectrometer.
A useful analogy for what happens when measuring ions was articulated by Donald Chace, a mass spectrometrist, who compared the process to counting change (this analogy is probably living on borrowed time as I can’t remember the last time I had any coins). Imagine that in your pocket you have a bunch of coins, for Kiwis this could be 10c, 20c, 50c, $1 or $2. These coins are equivalent to charged ions. They have different sizes and shapes just like ions can have different sizes and charges. The coins can be separated by their mass or size, and sorted into groups of the same size or denomination. A mass spectrometer does the same with ions and sorts them by mass and charge. Pile your coins up and you can determine how much money you have simply by counting the coins (as long as you know the value of each). The mass spectrometer does the same, counting the ions to determine how much of a substance you have. The number of coins you have can be represented in many ways, from a simple pile to a bank balance. Mass spectrometry data can also be represented in different ways. The most common is a line diagram known as a mass spectrum.
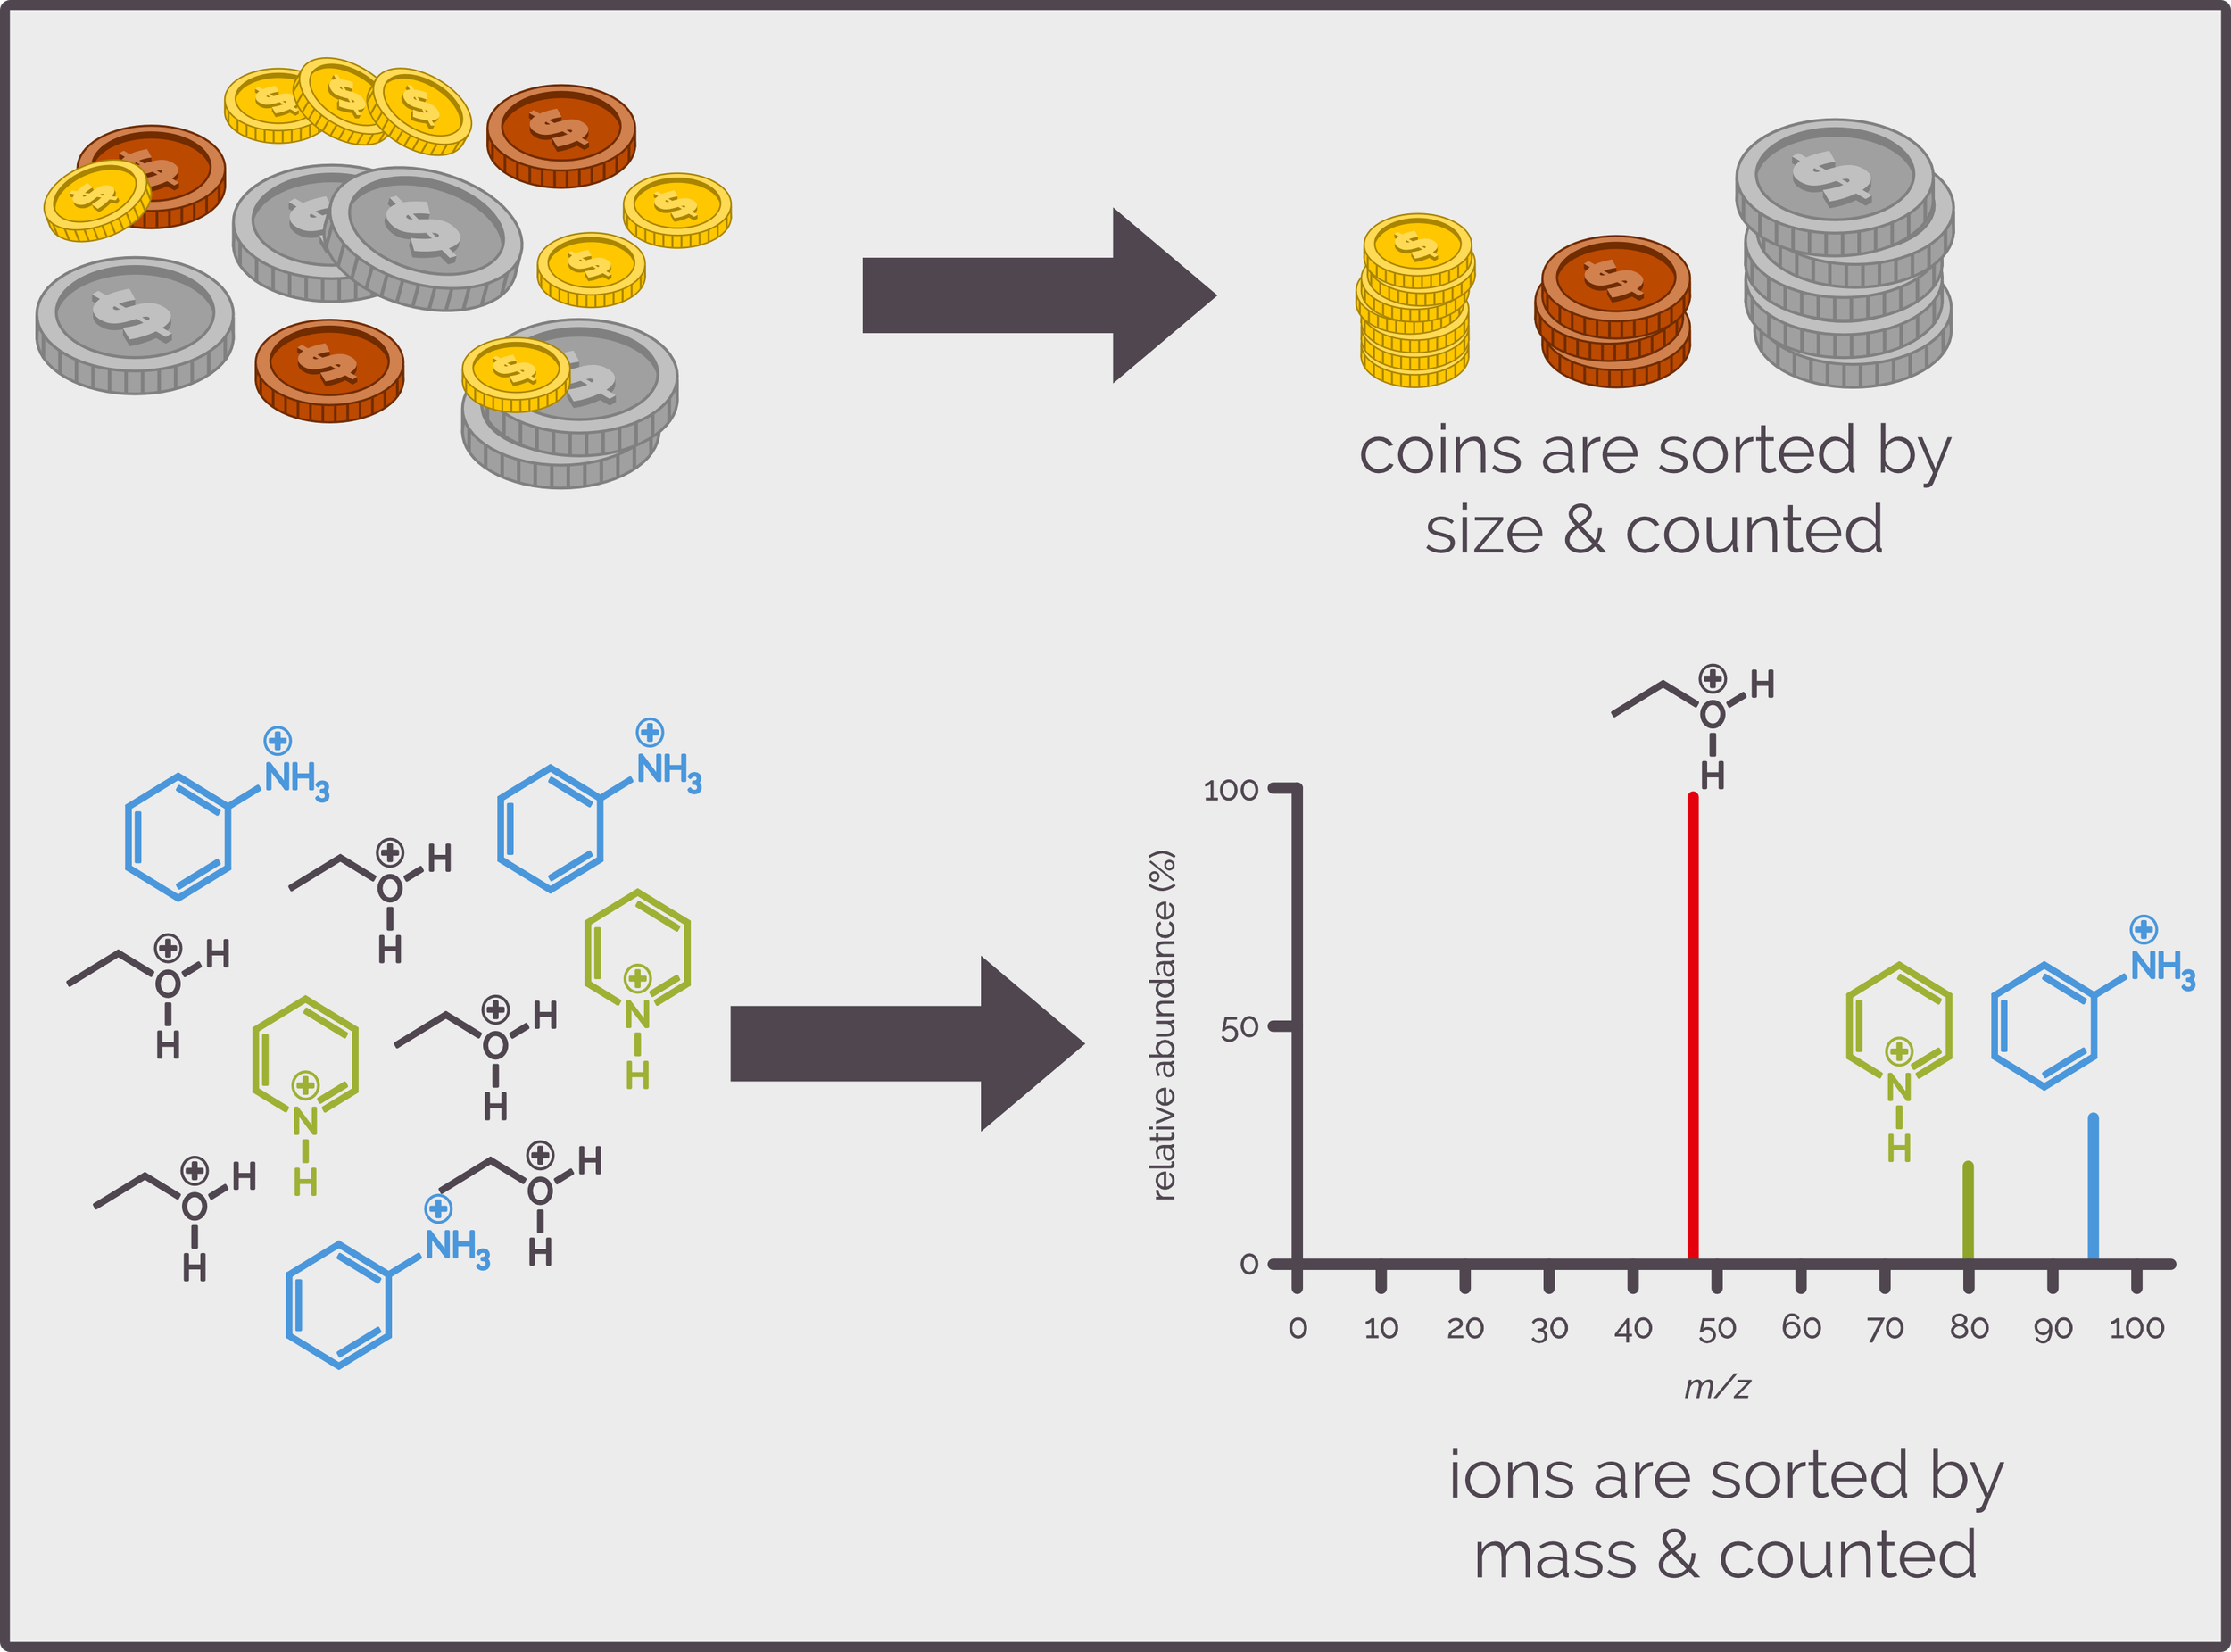
Coins can be sorted by size and/or denomination. You can then count how many of each you have and determine how much cash you have. Mass spectrometry is the same, it sorts and counts ions so that you can determine how much of each ion is present.
Mass Spectrometer Data
For many organic chemists, their only interaction with mass spectrometry is looking at a mass spectrum (often they don't even get that far and just copying out the high resolution accurate mass/exact mass) to satisfy journal requirements), but it is useful to have a vague clue as to how those results are obtained. In every mass spectrometer ions hit a detector that records an electronic signal that varies in relation to the mass-to-charge m/z ratio of the ion and the intensity or number of ions causing the signal, and I’ll discuss this in a little more detail in another summary. This information can be displayed in four ways. The first is a table of all the signals received, ordered by m/z and intensity. This can be plotted as a continuous line known as a profile mass spectrum. This shows all the data including the resolution of peaks (a peak is defined as the abundance or concentration of an ion that is greater than the background noise both electronic and sample based). This is simplified into the spectra most of us are familiar with, a bar graph, where each peak is represented by a single vertical line drawn through the centroid of the profile and whose height represents the area of the peak from the profile spectrum. Funnily enough, this is called the centroid mass spectrum. Finally, these lines are converted back into a table of data that lists considerably fewer m/z and intensity values.
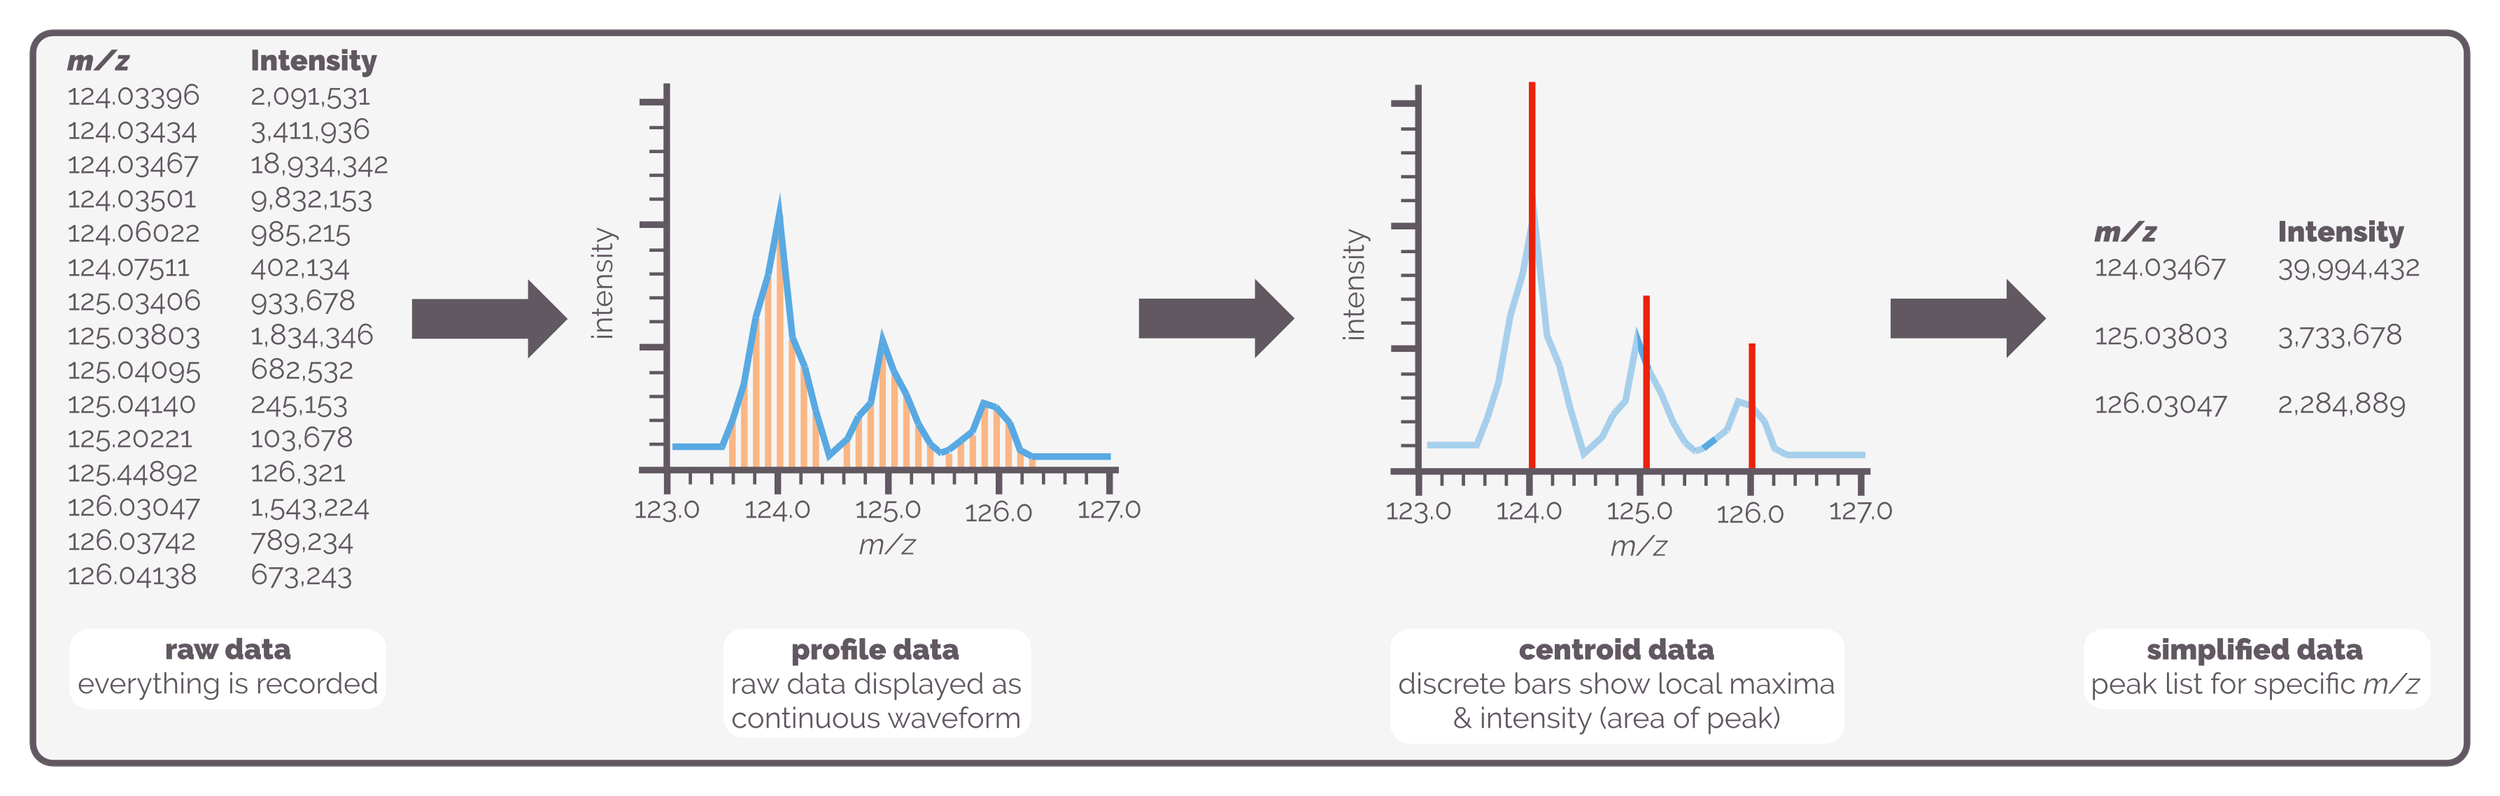
The data from a mass spectrometer can be displayed in multiple formats. There is the raw experimental data. This is every data point collected. The files are huge and processing can be time-consuming. Then there is the profile data that plots all the measured m/z points and their intensities as a continuous wave. Good for looking at peak shape and noise. Then there is the common representations, first the centroid data, a bar chart showing discrete m/z values that are the centre of the peaks and have a height that is related to the area of the peak. Then there is the simplified peak list created from the centroid view.
Bar-Chart Mass Spectrum
The bar-chart simplification, known as a centroid representation, is the format of mass spectrometer data that most organic chemists and undergraduates encounter. A cartoon version is given below and it highlights the important features of a typical mass spectrum.
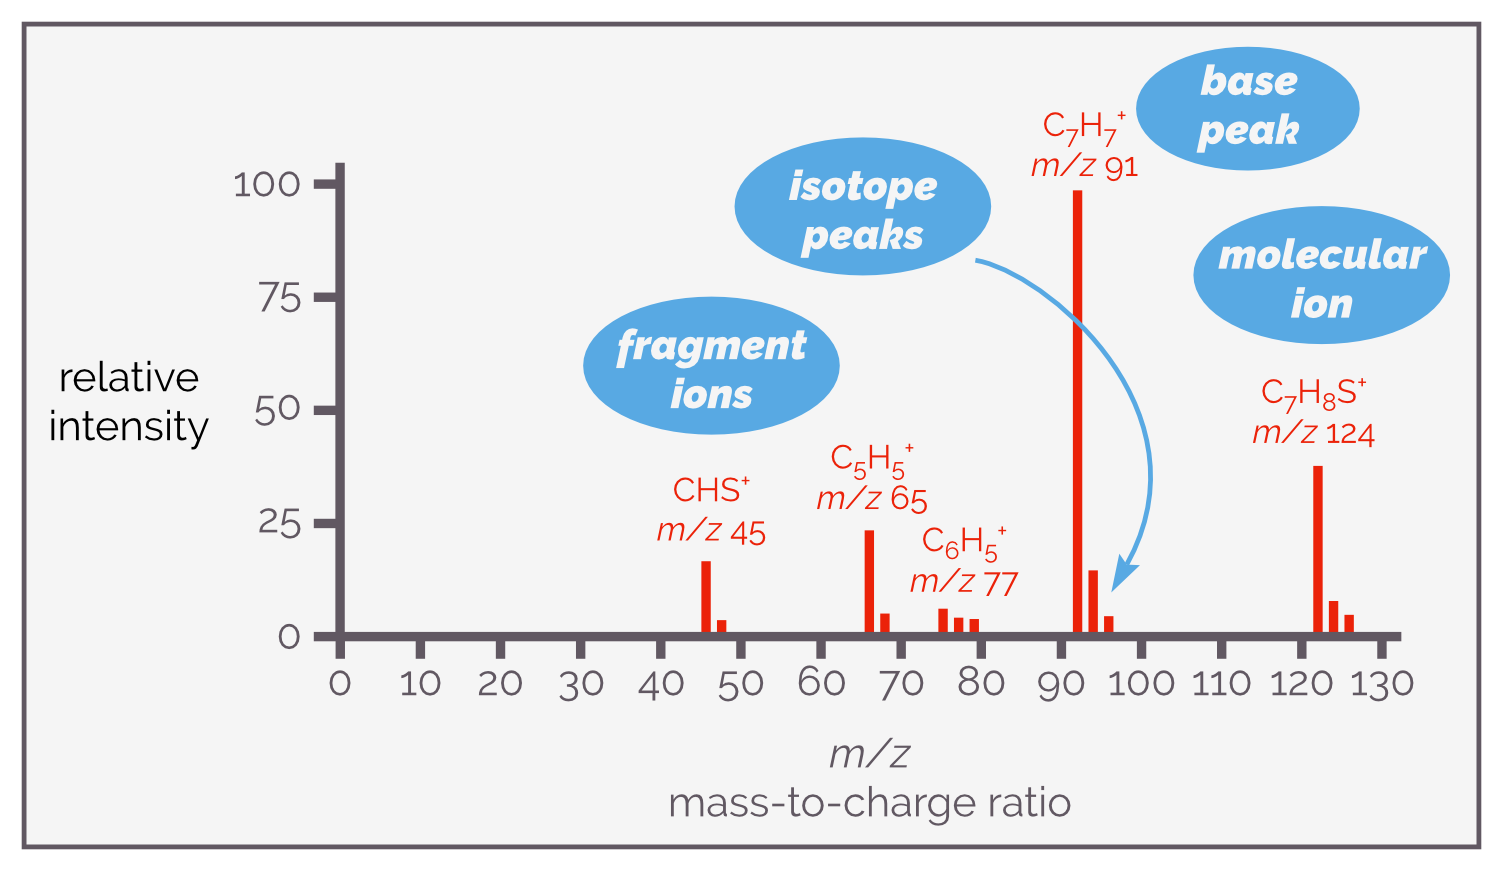
An example of a centroid representation of mass spectrometry data, in this case, for electron impact ionization of benzyl thiol. It shows the four key areas that I’ll discuss; the molecular ion at m/z 124, the base peak at m/z 91, the fragment ions at 77, 65, and 45, and the isotope peaks to the right of each of the major peaks.
The spectrum shows ions recorded as the mass-to-charge ratio or m/z and not their mass. Commonly, the y-axis or the height of the peaks reflects relative intensity of the peak compared to the most intense peak (the base peak). The base peak is nominally set at 100 and the other peaks will all be less intense. It is possible to change the scale so that it shows absolute intensity, a value proportional to the abundance or quantity of ion detected.
The mass-to-charge ratio m/z is a dimensionless number rather than a specific unit. As it has no SI units m/z should always be in italics and there should never be an equals sign. The mass, m, is normally quoted in Daltons, Da, (technically, as a Dalton is a unit Da should be non-italic but I use italic as highlighting) where a Dalton is the same as the unified atomic mass unit (amu), u, that has one atom of carbon-12 equal to 12 u or 12 Da (so 1 Da = 1.66 x 10⁻²⁷ kg). The term mass is a little more confusing than most organic chemists realise (or it might just have been me) and I'll discuss this later just for a laugh.
The electrical charge of the ion is given by z. A single charge is the electromagnetic force associated with either a proton, +1, or an electron, –1. For most undergraduate courses, the ion will only have a single charge and m/z will have the same value as the mass of the ion. If the ion has a charge of ±2, or more, things can start to get complicated as m/z will be fractional. For example, a molecule of mass 99 that is doubly protonated will show an m/z of 50.5 (the original 99 Da + 2 protons of mass 1 Da each all divided by two or [{99+2}/2]). These fractional values are useful when inspecting the spectrum of molecules such as peptides but that is a story for another day.
The peak with the largest m/z value, the line furthest to the right in the cartoon above (ignoring the isotope peaks, which will be discussed below) is often the molecular ion, and can represent the molecular mass of the sample or one of its simple derivatives (mass spectrometry is not simple, the process of ionization is brutal and can alter the structure of the analyte but, again, this kind of detail will have to wait for another summary). The structure of the molecular ion will depend on the ionization mode, how the sample was converted into an ion. Common molecular ions are [M]+•, which represents a positively charged species that has lost an electron (often the dot is missed off but I think it is helpful). Other examples include, [M+H]+, an ion formed by protonation of the sample while [M+Na]+ is the sodium adduct. I hope you get the idea!
When the sample of analyte, M, is ionized it is given energy. The energy is distributed throughout the molecule and can cause bonds to break. This leads to the formation of fragment ions and is known as fragmentation (shockingly). These fragments are smaller than the original ion, they have a smaller m/z and lead to peaks to the left of the molecular ion. An example is shown below and is a typical fragmentation pattern for a ketone. Only the charged oxonium ion is visible in a mass spectrum; the methyl radical does not show up. Remember, mass spectrometry only works for charged species, anything neutral will not be manipulated by the instrument.
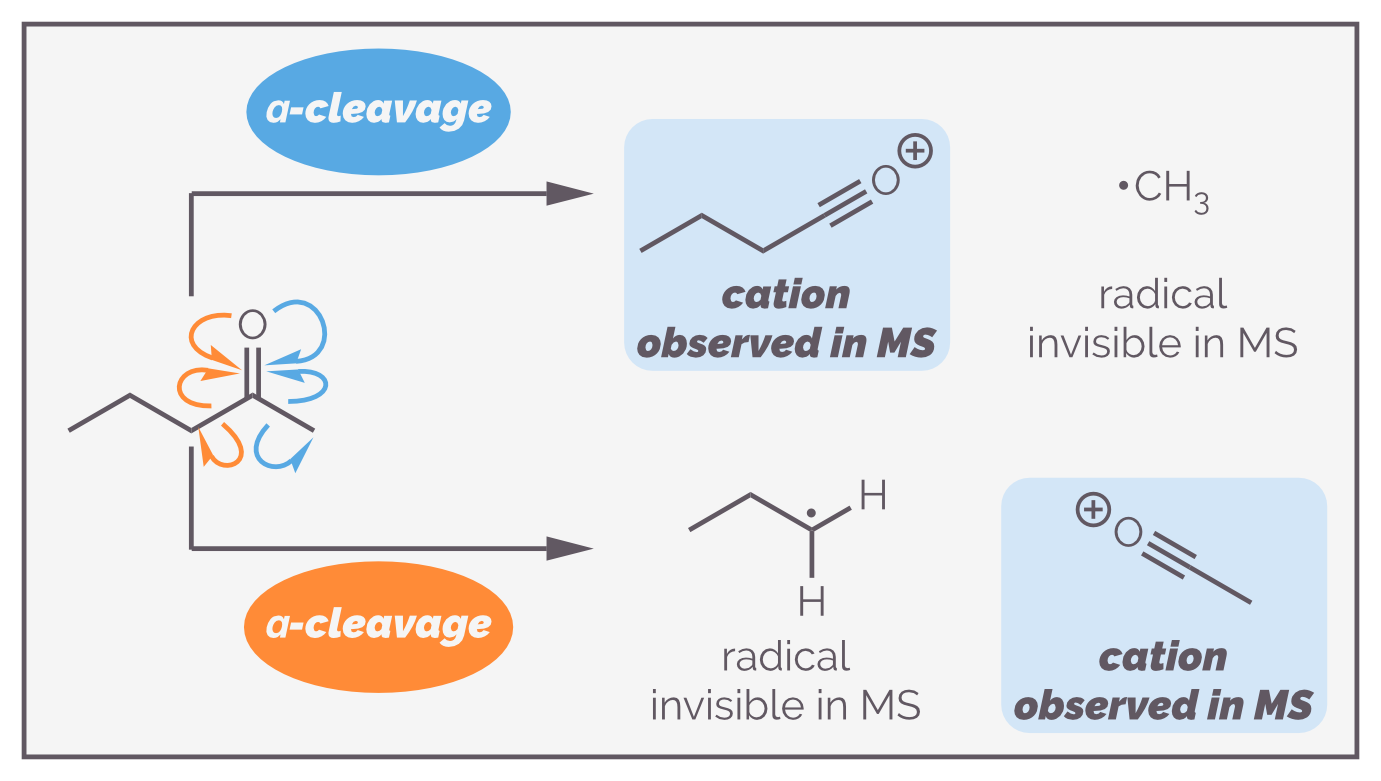
When a molecule is ionized it is given energy. This energy is sufficient to break bonds. Often these fragmentations occur in predictable ways (but I’m not convinced this is always the case). A molecule can be broken into multiple fragments, and those fragments can break apart still further. This can be useful when determining a structure. Remember only charged fragments will produce a peak in the mass spectrum. No charged species are not measured by a mass spectrometer.
The biggest or tallest peak is known as the base peak and represents the most stable ion formed during ionization. This does not have to be the same as the molecular ion. Fragmentation can form multiple charged ions, for example the α-fragmentation of the ketone above could break either C–C bond next to the carbonyl group resulting in either a butylidyneoxonium (an oxonium species with a propyl chain) and a methyl radical or an ethylidyneoxonium (an oxonium species with a methyl group attached) and a propyl radical. Some fragments are more stable than others. The most stable ion will be the most abundant fragment and will have the tallest or base peak. The intensities of these peaks are often normalized to the base peak so that it is 100%
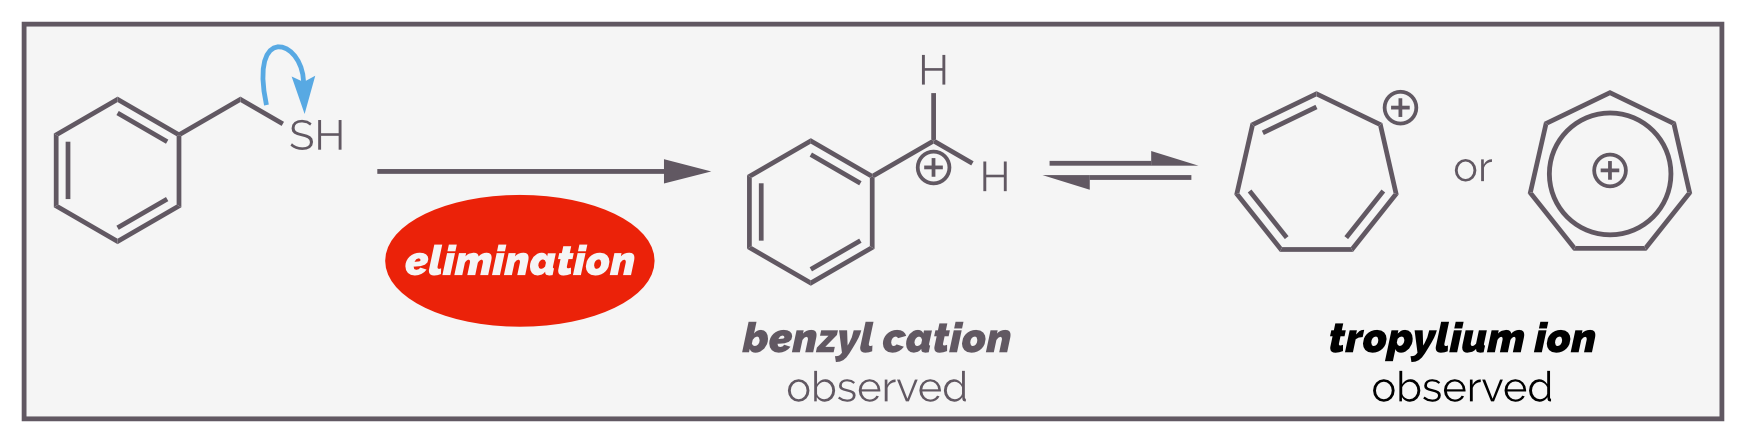
The the base peak in the mass spectrum above is formed by fragmentation of benzyl thiol to give a highly stable an ion, the benzyl cation or tropylium ion. As this cation is relatively stable, it is the most intense peak.
To the right of most molecular ions, base peaks and fragment peaks are lesser or smaller peaks (this is normal but doesn’t occur with every peak). These are isotope peaks and are created if the sample contains atoms that exist as isotopes. In organic chemistry, by definition, all organic molecules contain carbon and this has two 'common' isotopes, carbon-12 (12C) and carbon-13 (13C). In undergraduate lectures on mass spectrometry, the two most important elements with isotopes are chlorine (chlorine-35 and chlorine-37) and bromine (bromine-79 and bromine-81).
Isotope peaks are either useful or annoying depending on what you are looking at. The natural abundance of chlorine isotopes leads to distinct patterns of peaks in the spectrum. The ratio of chlorine-35 to chlorine-37 is 3-to-1; if the molecule contains a single chlorine atom, the molecule ion, and any fragment that contains the chlorine, will appear as two peaks in a ratio of 3:1 (see below). This can make identification easier.
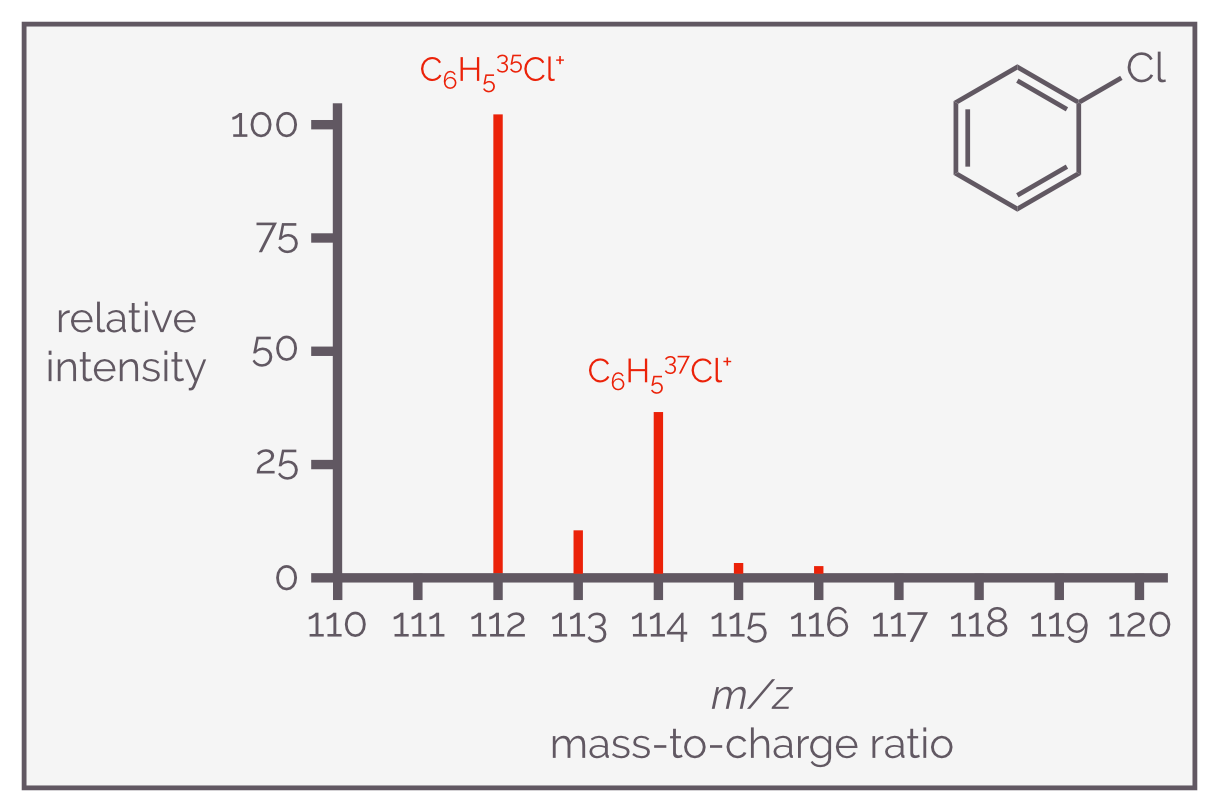
The diagram shows the molecular ion for the electron ionization of chlorobenzene. The radical cation shows two distinct peaks in the ratio of 3:1. One is for 35-Cl isotope while the other is for the 37-Cl isotope. The observant amongst you will notice the other smaller peaks at 113, 115 and 116, these are due to 13-C isotopes.
If the molecule contains two chlorine atoms then there will be a distinct group of three peaks in the ratio 10:6:1 that represents a molecule that contains two 35Cl, one 35Cl and one 37Cl or two 37Cl atoms. This is shown for 1,2-dichlorobenzene below:
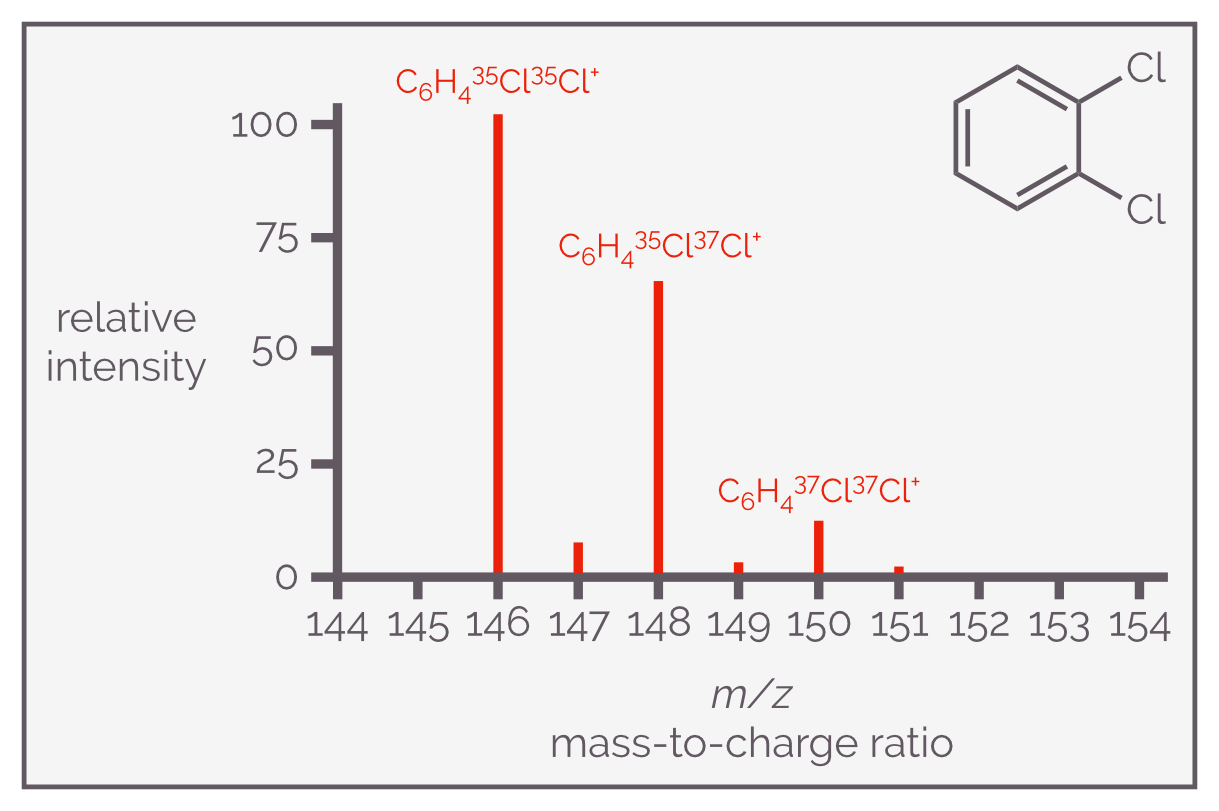
The mass spectrum of 1,2-dichlorobenzene shows a group of molecular ion peaks in the ratio of 100:65:10 that corresponds to the potential combinations of the two isotopes of chlorine. This pattern is common for all simple dichloro compounds.
Bromine exists as two isotopes, bromine-79 and bromine-81, in the ratio of 1-to-1. Its compounds will have a distinct pattern of peaks but these will be different from the chloro compounds as the relative abundance of each isotope is different. The peaks in the spectrum of a monobromo compound will be 1:1 while that of a dibromo compound will be 1:2:1.
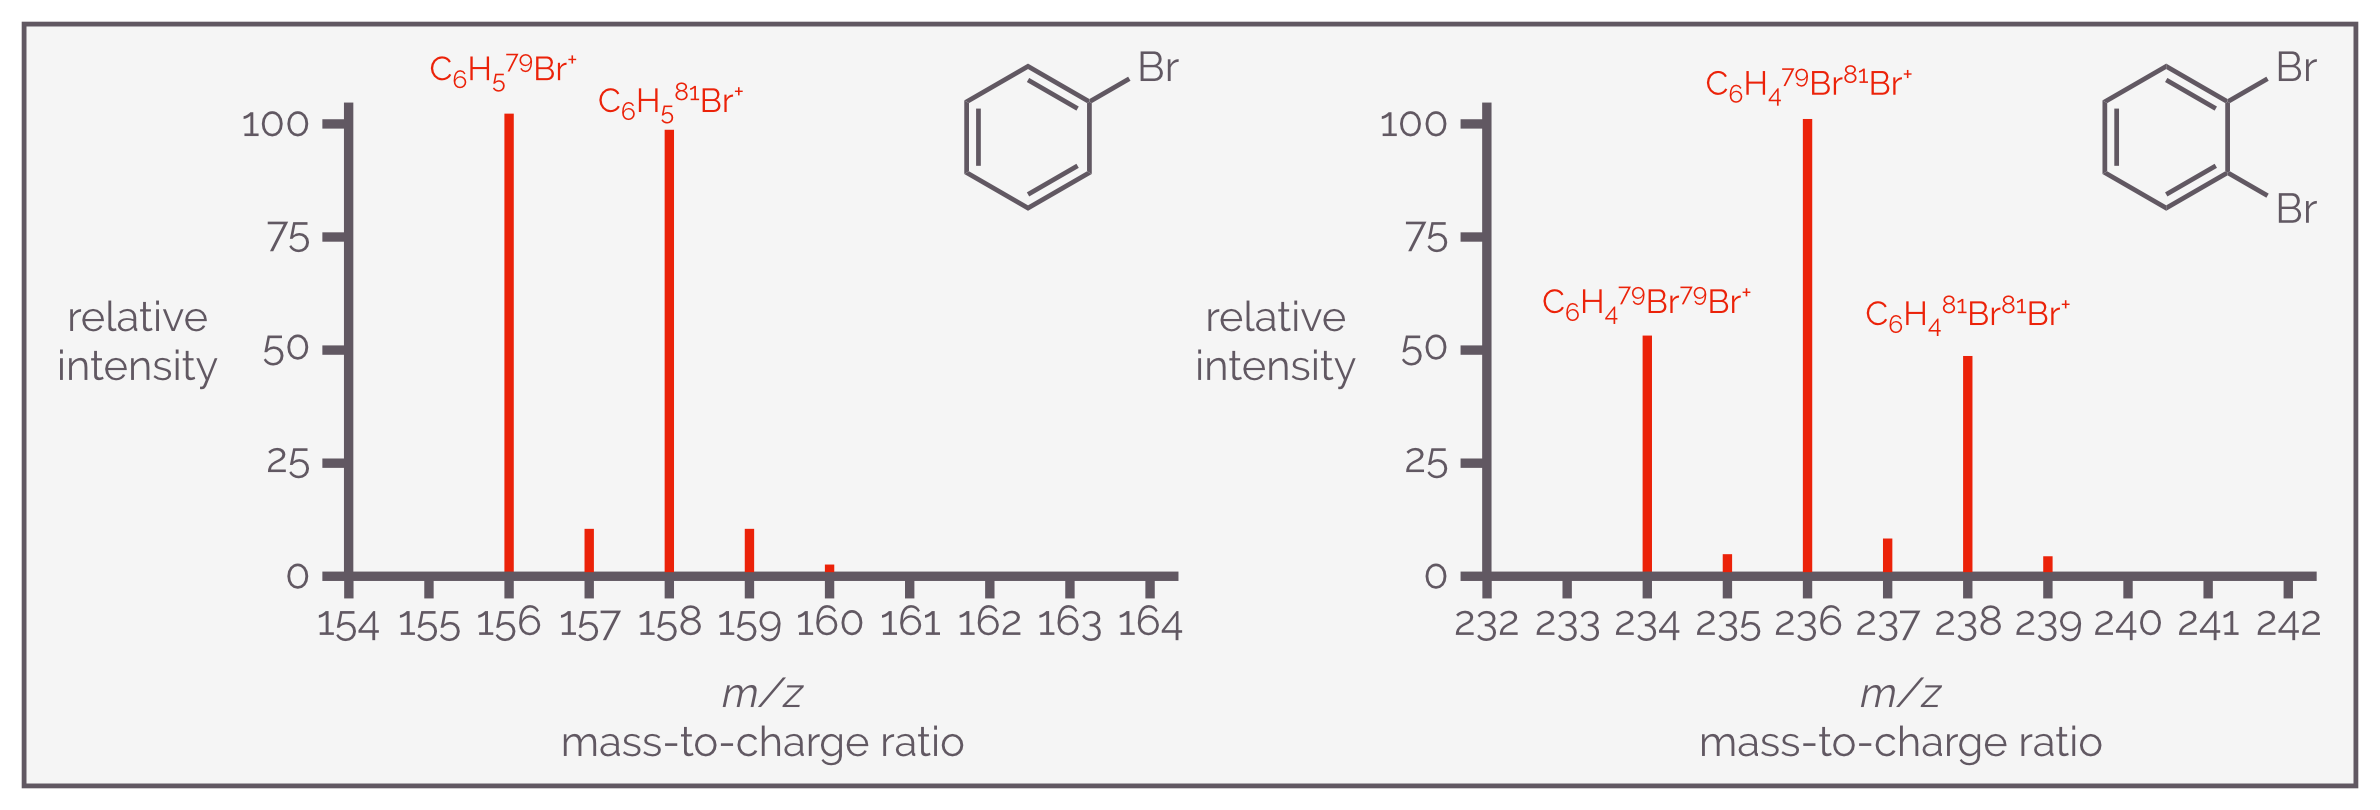
Bromine exists as two isotopes like chlorine but the relative abundances are different. This means the isotope pattern for the molecule ion packet is different. For bromobenzene there are two peaks in a ratio of 100:100 (actually 50.7:49.3). If there are two bromine atoms, there will be three peaks in the ratio of 50:100:50. This indicates that there is roughly twice the probability of the compound containing both a 79-Br and a 81-Br rather than two of the same isotope. This pattern is true for all simple dibromo compounds.
Carbon-13 has a natural abundance of 1.1% and for a molecule like methane this is of little importance (in mass spectrometry) but as organic molecules get bigger this isotope becomes more significant. The bigger the molecule, the more chance that one of the carbon atoms will be carbon-13. This means the isotope peak becomes more pronounced. The ratio of 12-C:13-C is given by the formula 100:(1.1 x n) where n = number of carbon atoms. If a molecule has 20 carbons, the isotope peak is approximately 5:1 (or 100:22).
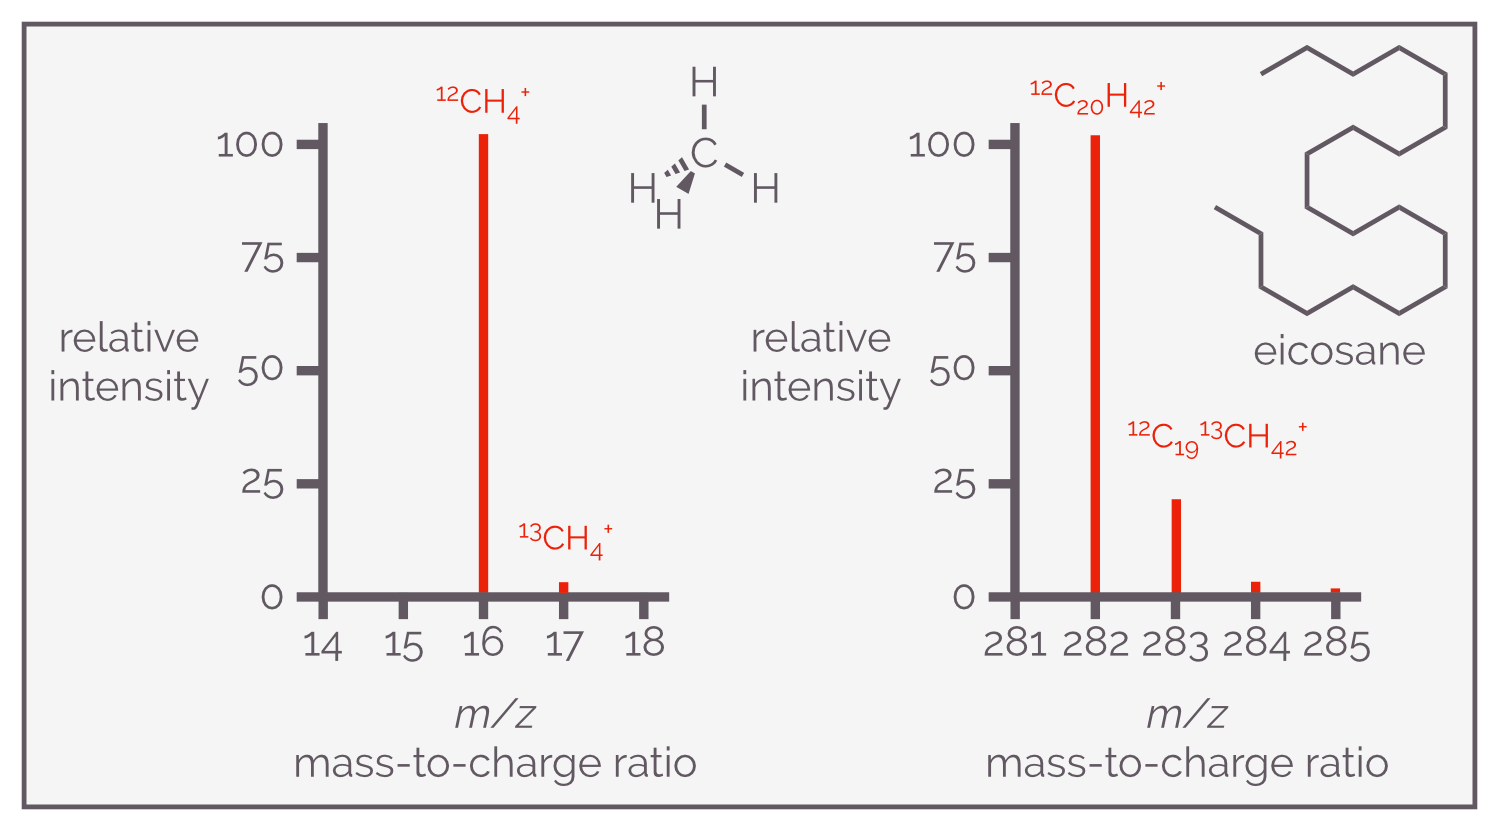
All organic compounds contain carbon and it exists as five isotopes of which two are important, 12-C and 13-C. 12-C is the most abundant with 13-C the next most abundant at 1.1%. This means it isn’t very important with small compounds but as the number of carbon atoms increases the probability of one of them being 13-C increases. This means the isotope peak for 13-C becomes more important. In methane, the M+1 peak is 1.1% but in eicosane, a twenty carbon chain hydrocarbon, it is 22%.
If you are looking at the mass spectrometry of biopolymers, isotopes of carbon become very important as there can be thousands of carbon atoms. A protein like haemoglobin contains just under 3000 carbon atoms. A structure of this size contains on average thirty three 13-C atoms (3000*0.011). As a result, the average mass is 33 Daltons greater than that calculated for 12-C. It means you will observe a peak with a significantly higher m/z than expected in the spectrum. In fact, you will see an envelop of peaks due the distribution of isotopes being uneven between all the protein molecules (in other words, one molecule of haemoglobin might have one 13-C while its neighbour has twenty). This would look horrible but don’t worry, you are unlikely to encounter such a spectrum as the isotopes are only the start of the issues of performing mass spectrometry on proteins and the mass spectrometry of proteins is a topic in its own right (their size means vaporization is hard, they can have multiple charge states and fall apart surprisingly easily).
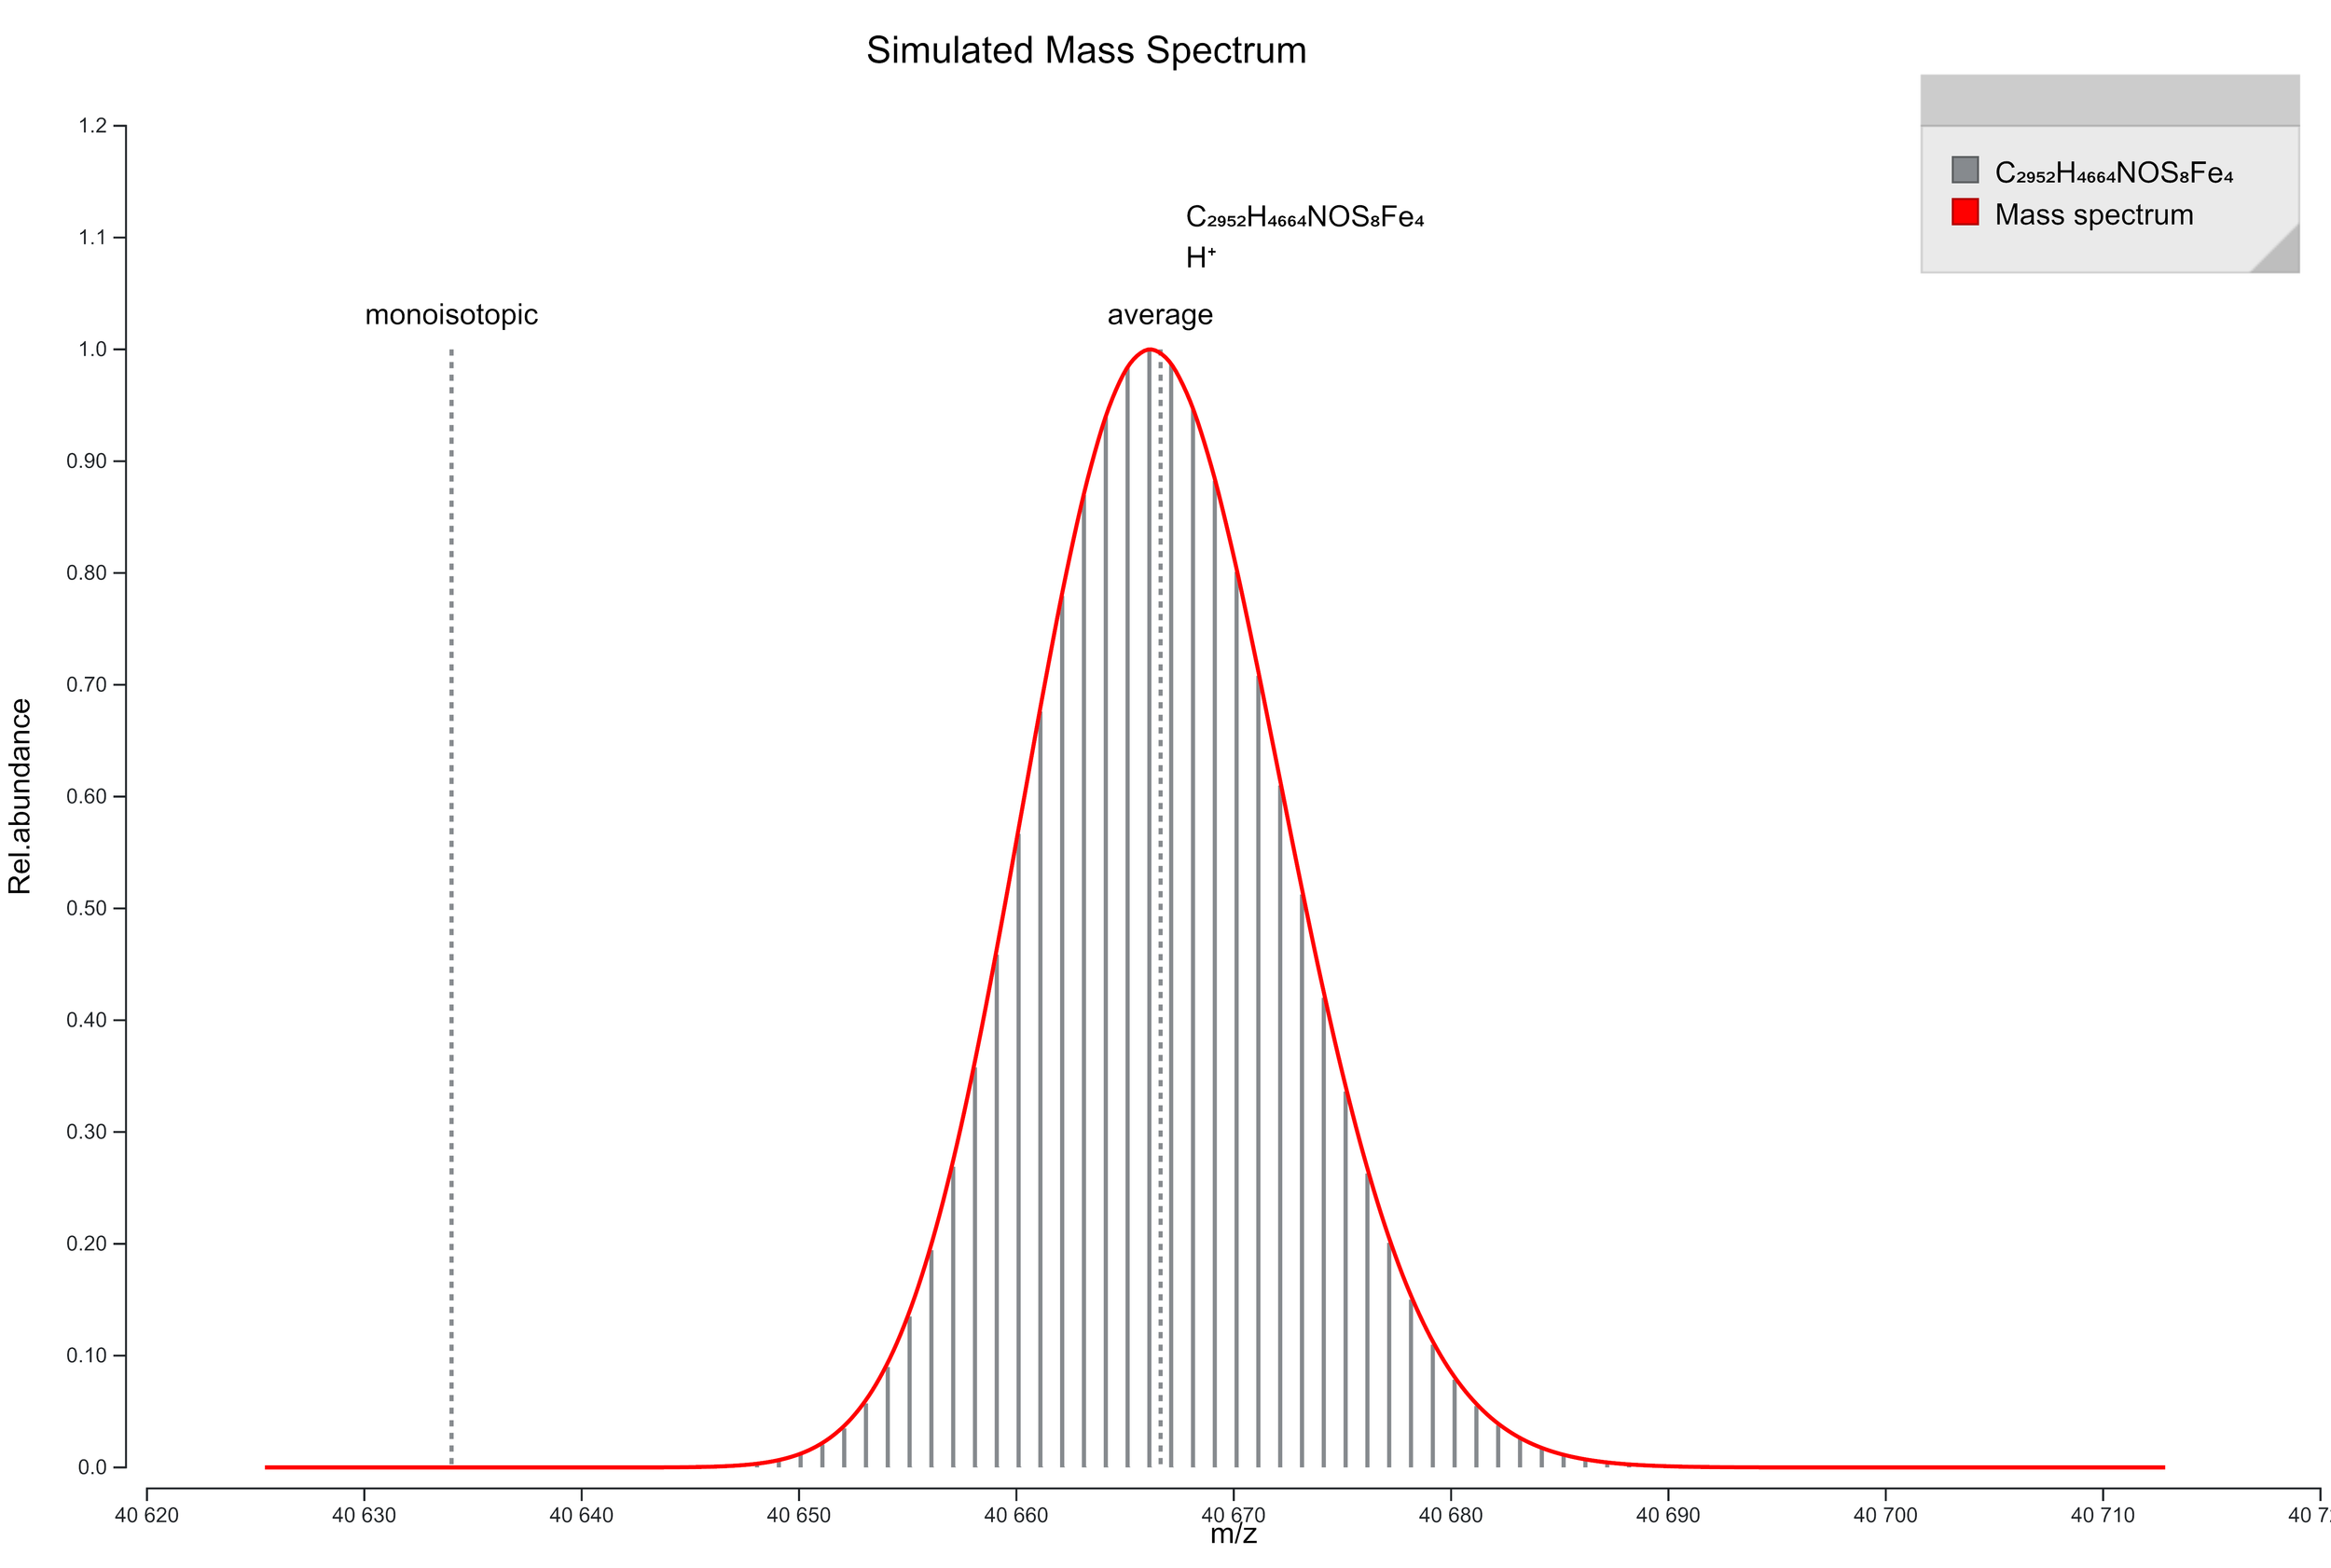
This shows a simulated mass spectrum of the molecular ion envelop for haemoglobin. It was made using the Prot Pi website https://www.protpi.ch. It shows two things; first, the monoisotopic mass is considerably lower than the observed mass envelop and secondly, there isn't a single mass ion for a molecule of this size (I'm ignoring all the issues of trying to get a protein to fly in a mass spectrometer and then the range of ionization states it would exist in depending on how many residues had been protonated).
Not Mass Spectrometry But An Interesting Aside: A Discussion on Mass
This seems like a good time to terrorize the unwary with a discussion of all the different versions of a molecule’s mass that exist. As an organic chemist, I spent most of my experimental life simply determining the quantity of a reagent I needed to add to my flask by using the rounded mass values found on a periodic table. This meant carbon = 12 g/mol, hydrogen = 1 g/mol, oxygen = 16 g/mol and sulfur = 32 g/mol etc. I was never going to weigh the reagent with any more accuracy so it seemed pointless getting bogged down on the wrong side of the decimal point. So for a molecule like cholesterol, the molecular weight was 386 Da (and, to be honest, I used grams not Daltons). What I called the molecular weight is officially known as the nominal mass.
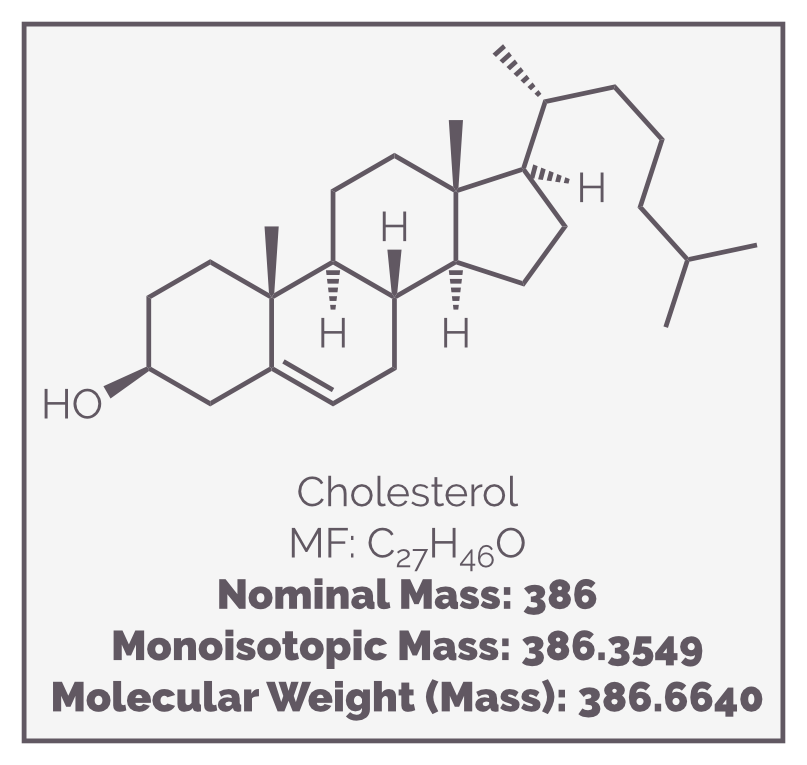
The mass of cholesterol can be described in different ways depending what mass of each atom you quote. This will normally be dependent on what you are trying to do.
The exact mass uses the precise mass of an isotope of each element and is based on the assumption that carbon has a mass of 12.0000 Da (or amu). This means hydrogen is 1.007825 Da and oxygen is 15.9949 Da. Now cholesterol will have a mass of 386.3549 Da. The monoisotopic mass is almost identical except that it normally refers to the most abundant isotope of each element. The exact mass is contextual and refers to whichever isotope you want it to be (so you need to state which one you are using).
The monoisotopic mass is normally the most relevant to those using a mass spectrometer as the instrument can differentiate each isotope and the most intense peak will correspond to the most abundant isotope or the monoisotopic mass.
Mass spectrometers that can measure m/z to four (or five) decimal places are known as high resolution mass spectrometers and these can use the monoisotopic mass to differentiate formulas of compounds that have the same nominal mass. I'll discuss high resolution mass spectrometers in another summary but to show you what I mean here are three compounds have the same nominal mass of 84 Da but have different molecular formulas (see diagram below). A high resolution instrument would be able to differentiate the ions formed from each of these compounds. A high resolution instrument can also determine the most probable molecular formula of an unknown compound.
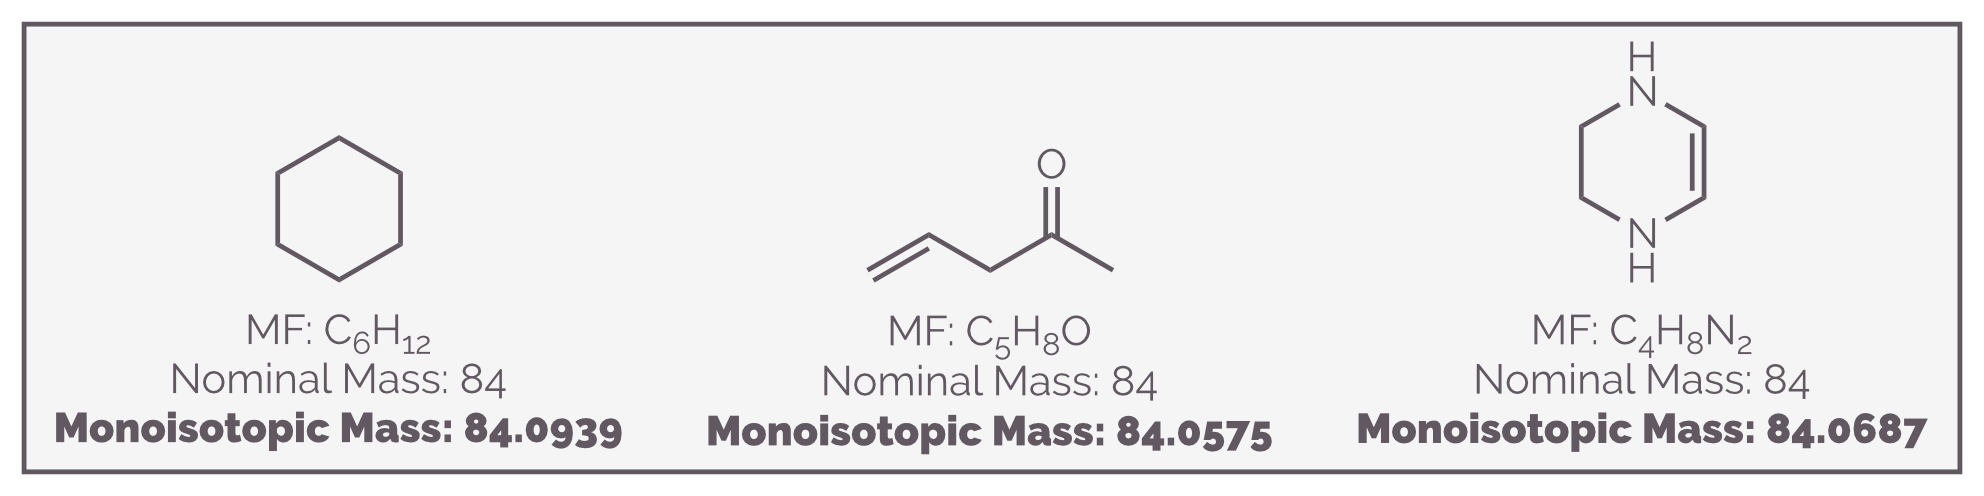
These three compounds have the same nominal mass, 84 Da. They would be indistinguishable with a low resolution mass spectrometer but a high resolution instrument, one that can measure the m/z to at least four decimal places would be able to tell them apart as their monoisotopic masses are different.
While I’m talking about determining molecular formula (well, differentiating potential formula), here is a helpful little hint that can help. The following statement holds true for molecules containing any of the elements C, H, N, O or S, if the molecule has an odd molecular weight then it must have an odd number of nitrogen atoms. If a molecule has an even molecular weight, it has either an even number of nitrogen atoms or no nitrogen atoms. The reason this guide works is that C, N, O and S all have an even atomic weight. Of the elements listed in this paragraph, only hydrogen has an odd weight. Only nitrogen forms three bonds, the other elements form an even number of bonds, so only molecules with one nitrogen (or an odd number of nitrogen) have an odd number of hydrogen and hence an odd molecular weight.
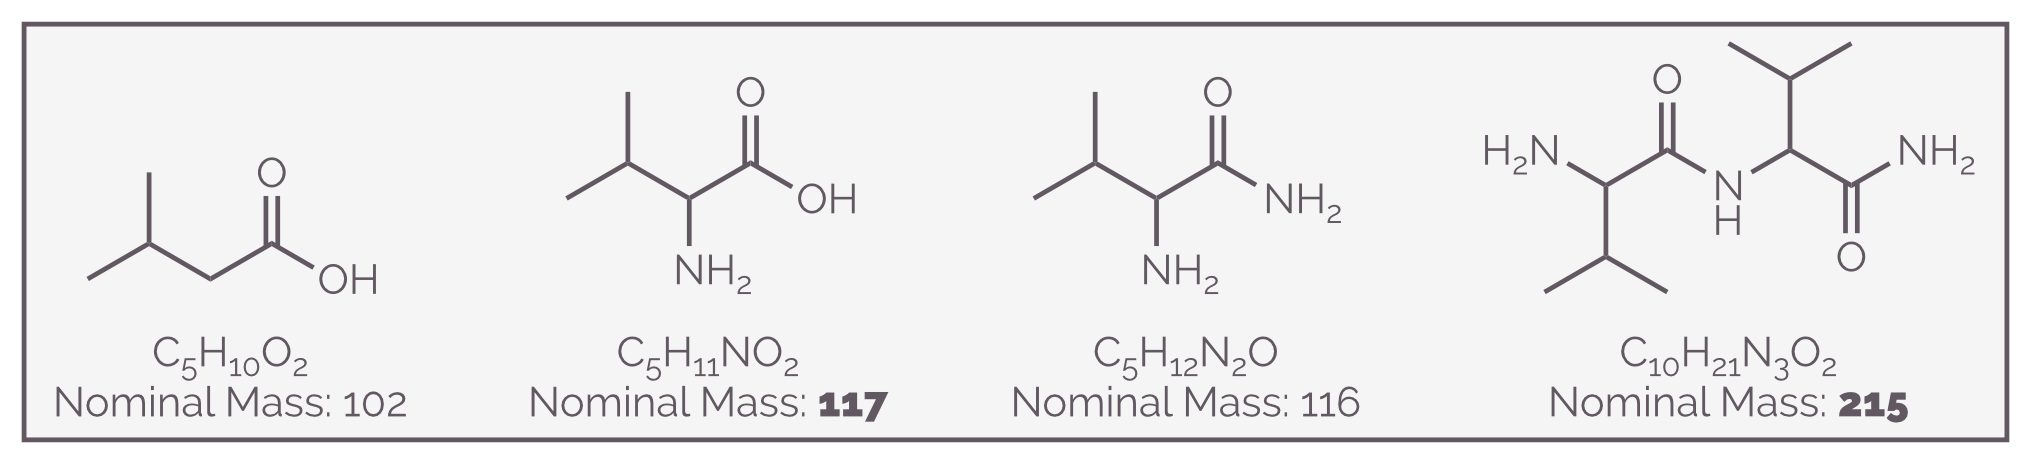
Simple organic molecules containing an odd number of nitrogen atoms will have an odd molecular mass. Those without nitrogen or with an even number of nitrogen atoms will have a even molecular mass.
Neither the monoisotopic nor the exact mass should be confused with the accurate mass. This is an experimental value. It is what your mass spectrometer measures and it will change depending on the instrument, how well you look after said instrument, the calibration and the method used.
A common meaning for molecular mass is the average mass taking into account all of the isotopes or average atomic masses. This is the value that gives you chlorine with an (average) atomic mass of 35.45 amu. Using average atomic masses, carbon is 12.011 amu, hydrogen is 1.008 amu and oxygen is 15. 999 amu. The average molecular mass for cholesterol is 386.662 Da. For a large molecule such as a protein, the difference between the monoisotopic mass and the average molecular mass can be huge, with the average atomic mass always being larger. The protein insulin is made up of two polypeptide chains and contains 51 amino acids, the difference between the average molecular mass and the monoisotopic mass is almost 4 Da.
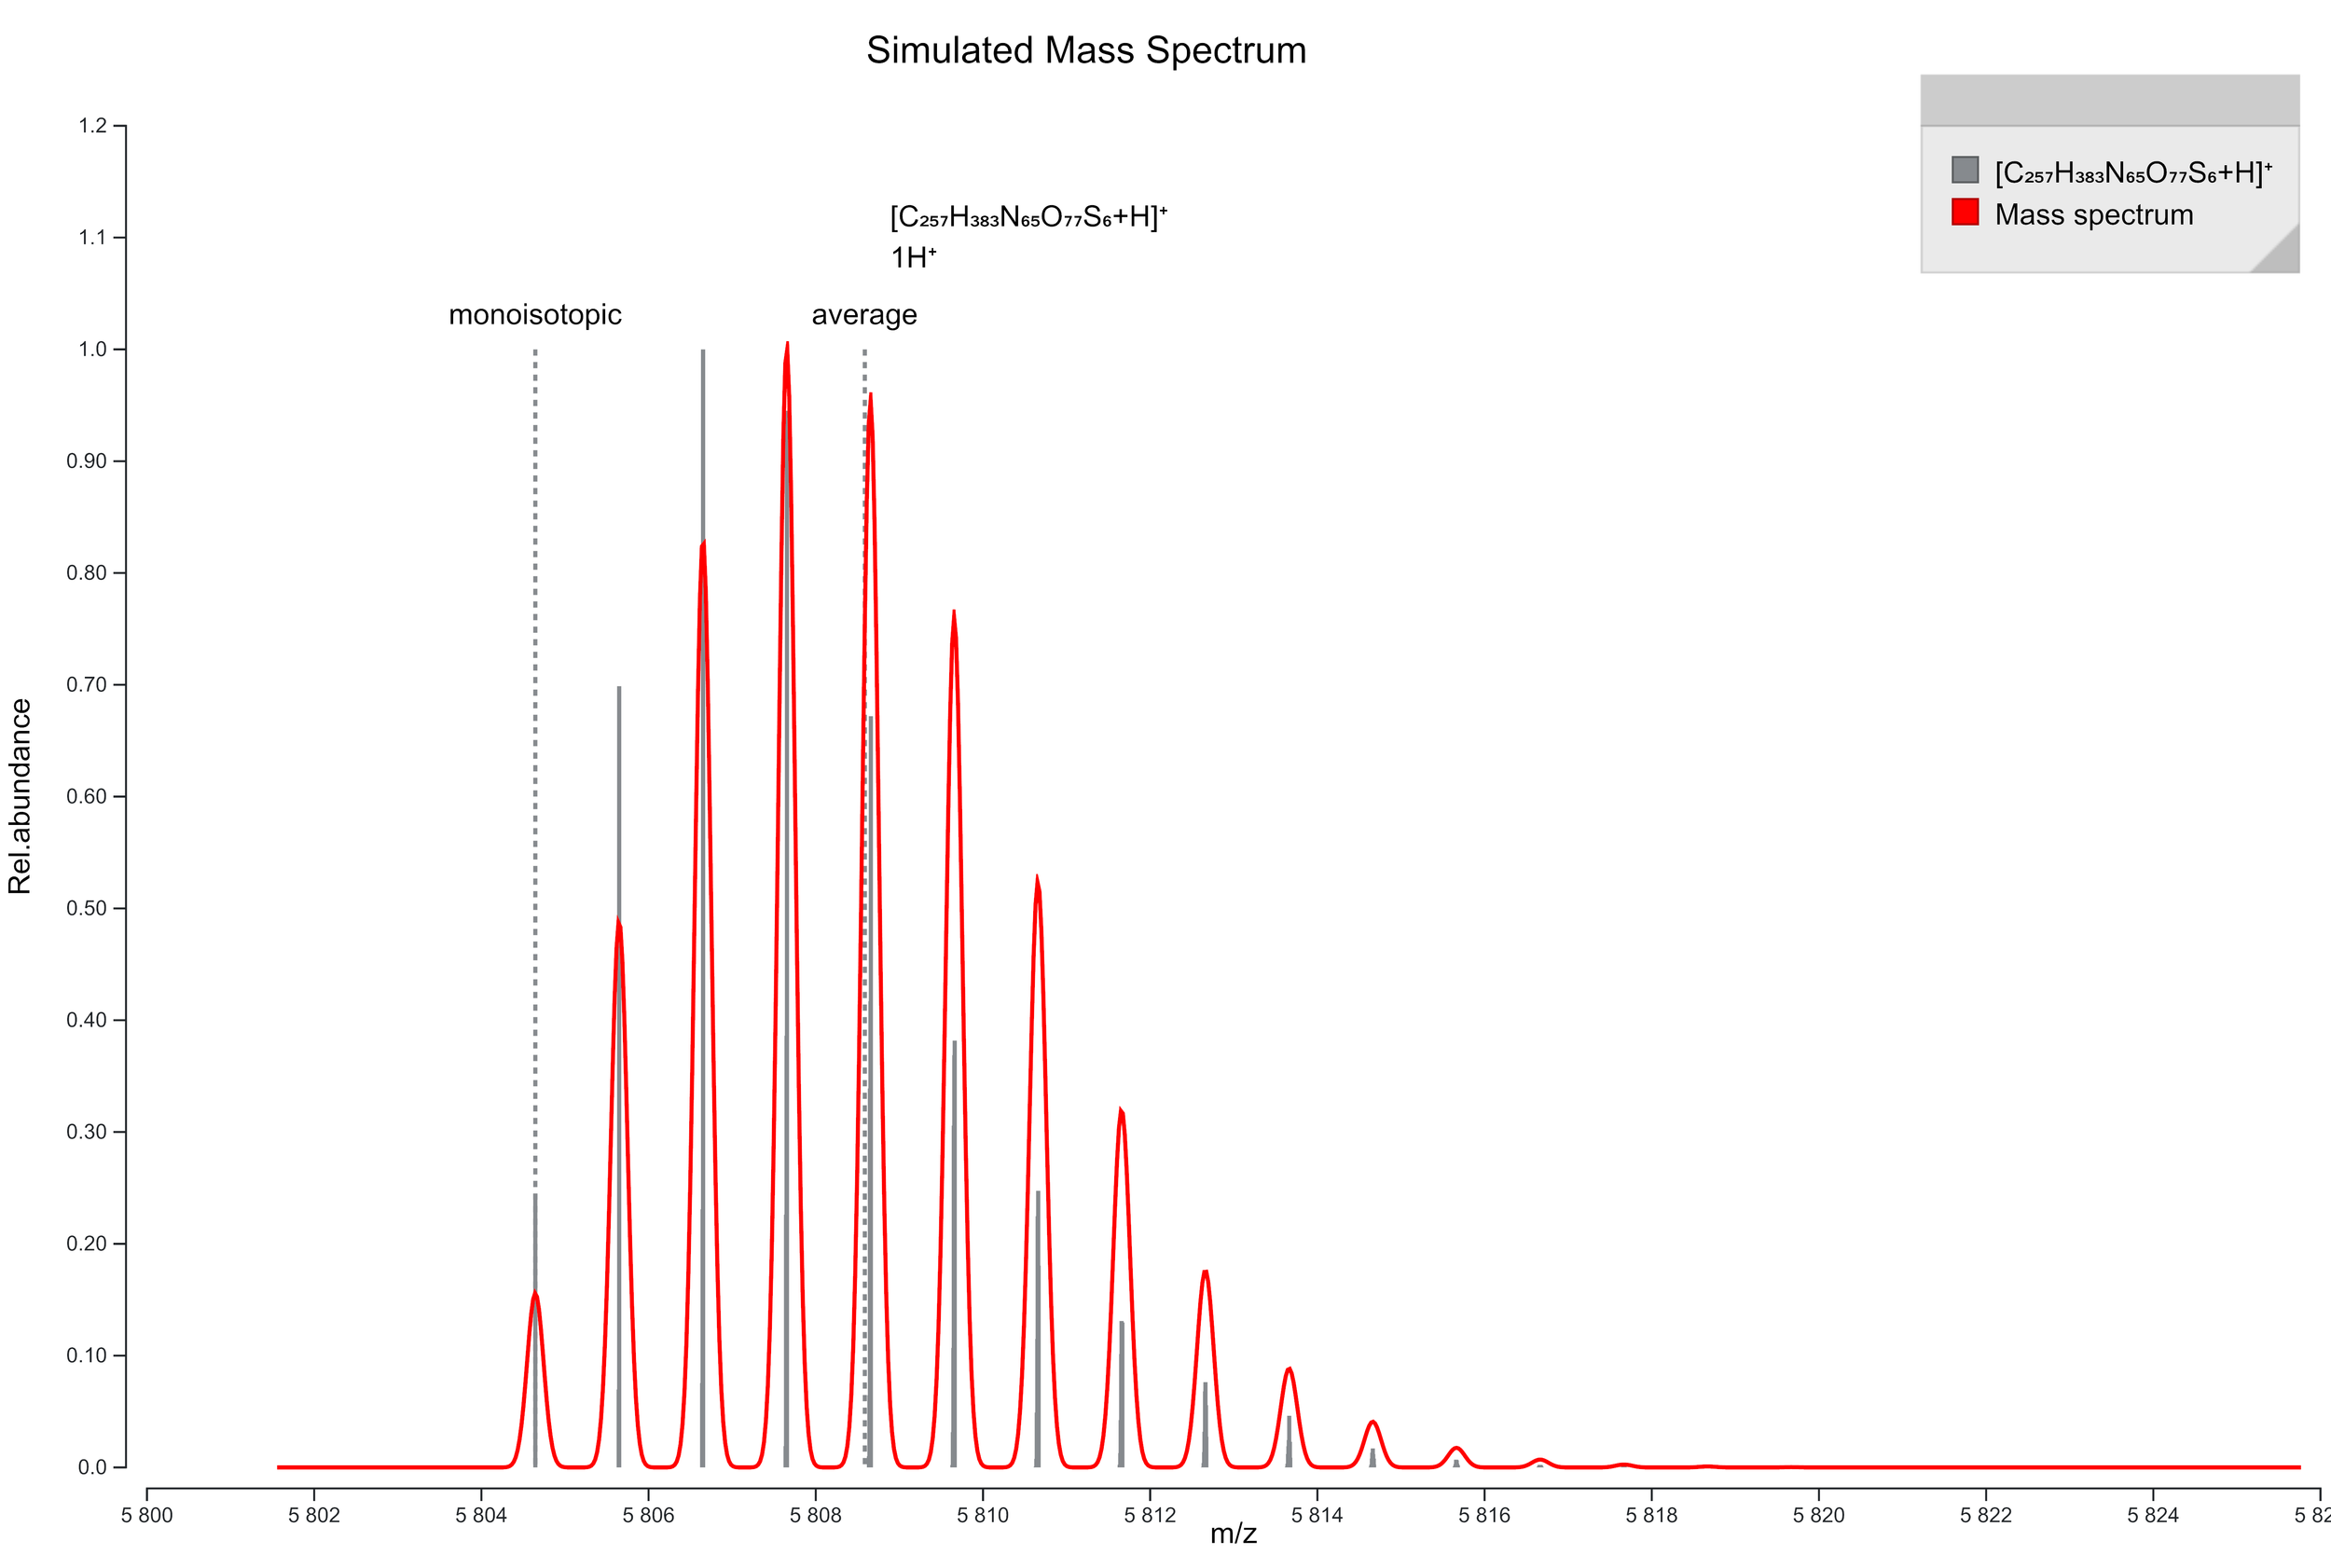
The diagram shows the simulated mass spectrum for a singularly protonated insulin, a relatively small protein, and you can see that the average mass is 4 Da higher than the monoisotopic mass. You can also see the influence of isotopes on molecules of this size and how it leads to a mass envelop rather than a discreet peak. The mass spectrometry of proteins is hard due to their size, their multiple charge states and propensity to fragment. It is more common to digest them and look at the mass spectrum of the resulting peptides. This diagram was created using the Prot Pi website https://www.protpi.ch.
The final ‘named’ mass is the isobaric mass. This describes two molecules that have the same nominal mass but different exact masses. On an old, low resolution instrument, the ions generated from these molecules might appear identical, or at least have the same molecular ion. For example carbon monoxide, CO, and nitrogen, N2, have an isobaric mass of 28 Da but have different exact masses at 27.9949 and 28.0062 Da respectively. This can be problematic with amino acids and peptides. Lysine, C6H14N2O2, and the dipeptide Ala-Gly, C5H10N2O3, have an isobaric mass of 146 Da but the exact masses are 146.1055 and 146.0691 Da.
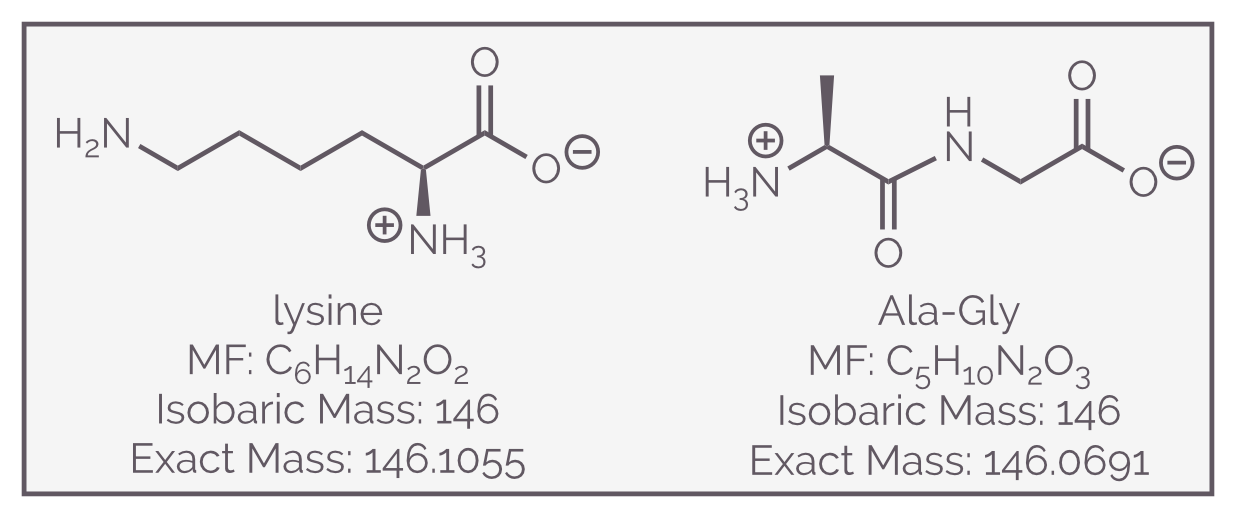
The amino acid lysine and the dipeptide Ala-Gly (AG, the combination of alanine and glycine) are isobaric, with the same nominal mass, 146 Da. They have different molecular formula and will be different by high resolution mass spectrometry or their exact mass.
Conclusion
Mass spectrometry is a useful tool that allows the identification of unknown compounds and the quantification of known compounds. Mass spectrometry is used to detect drug taking in sports, detect if patients have had a heart-attack from a sample of their blood, determine the composition of molecular species in space (and was at the heart of the discovery of buckminsterfullerene/bucky balls as an offshoot of such space research), monitor fermentation, detect toxins, and contaminants in food and the environment. It can also be used to sequence peptides and proteins. It is a vast field. It is also a technically complex area and this summary is supposed to be a simple introduction. All I have discussed is what it does and what the output looks like (for organic chemists). In subsequent summaries, I’ll discuss instrumentation and ionization as well as fragmentation.